
Dashboard overview
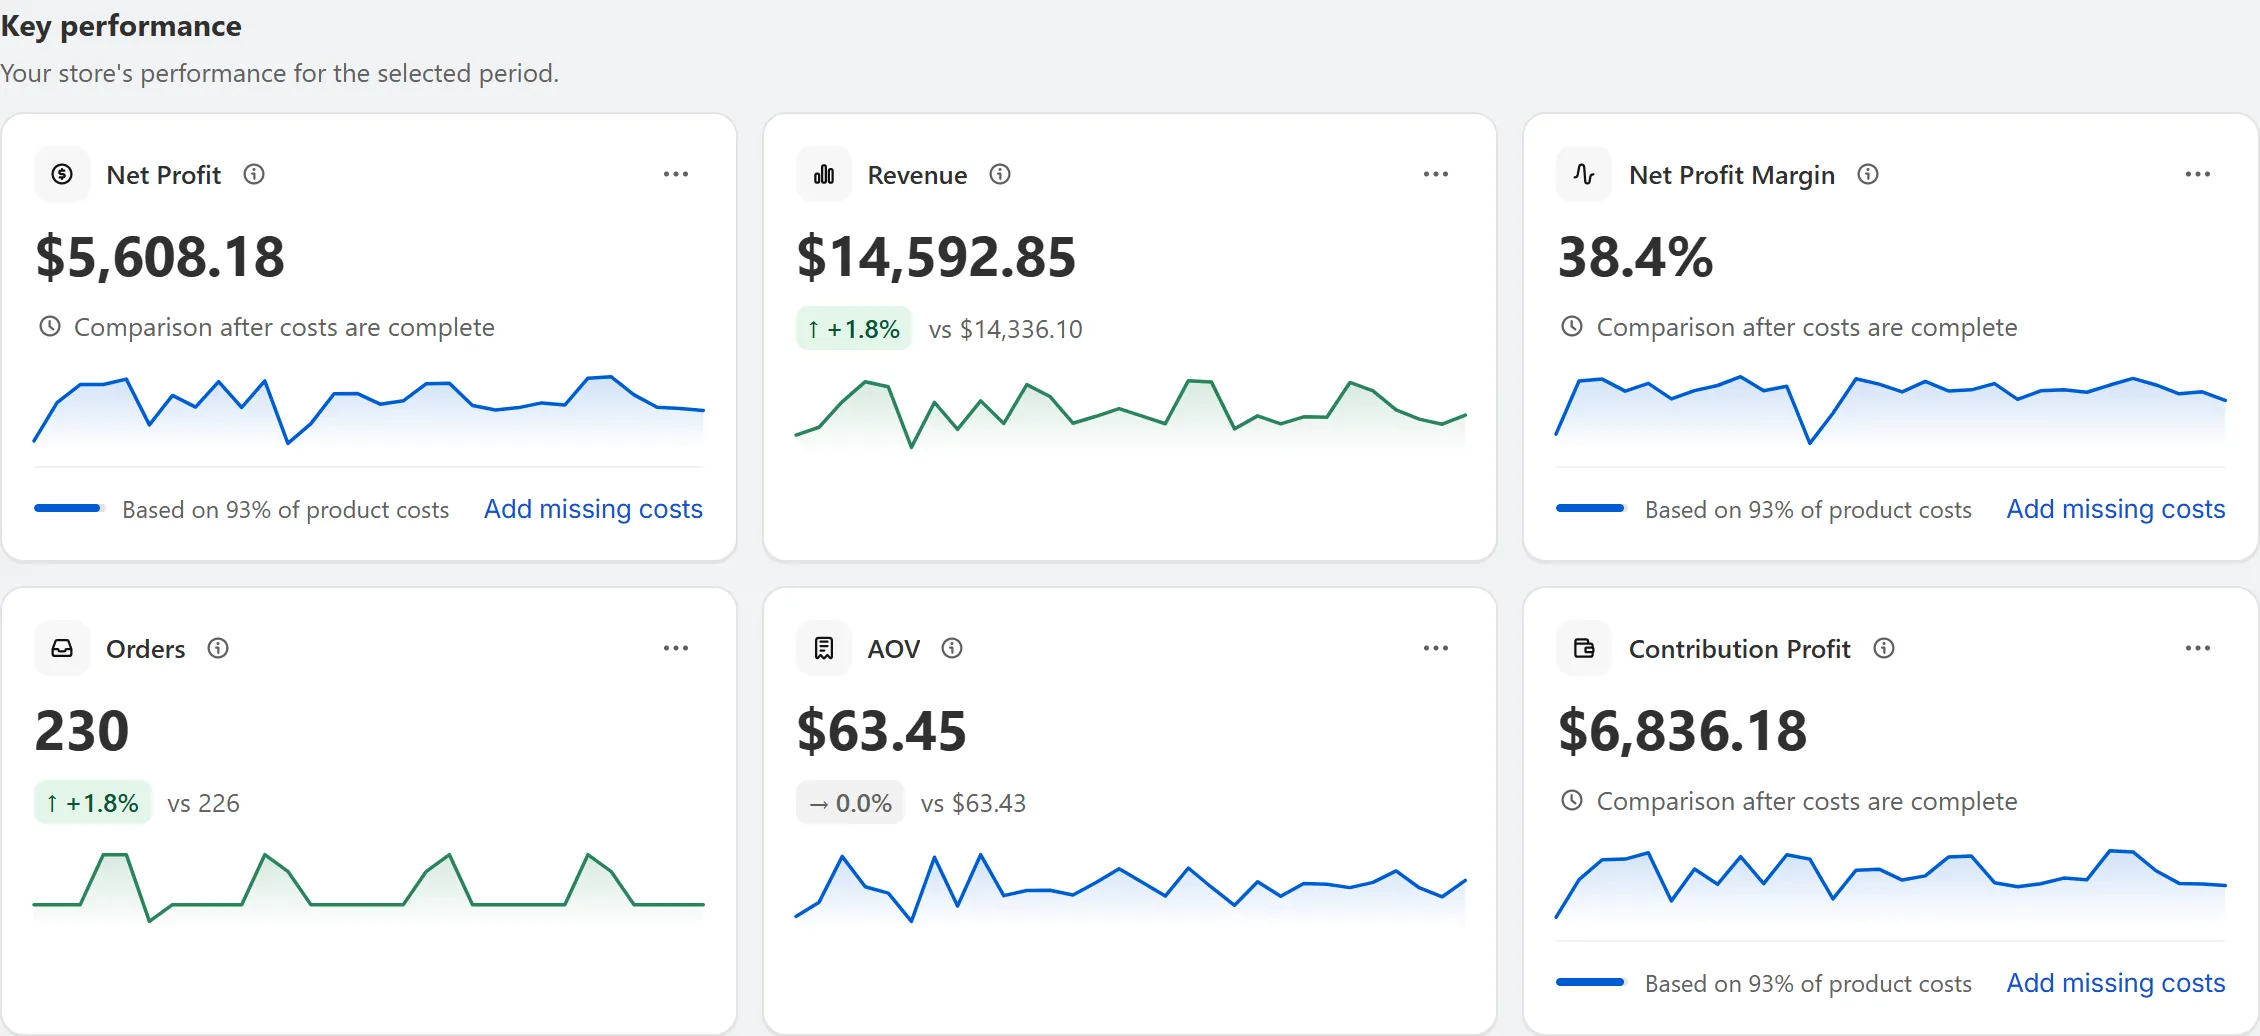
Shown with sample data.
Date range and comparison
Section titled “Date range and comparison”Choose a preset (today, last 7 or 30 days, this month, last quarter and more) or a custom range. Pick a comparison: previous period, previous month, previous year or a custom period.
Today so far
Section titled “Today so far”The row at the top shows revenue, orders, AOV and gross profit for today so far, compared with yesterday up to the same time, so half a day is never set against a whole one. View today’s orders opens them in Orders.
Reading a card
Section titled “Reading a card”- Value for the selected range.
- Change against the comparison, coloured by whether higher is good for that metric.
- “vs” value from the comparison period.
- Sparkline of the trend across the range.
- Coverage note at the bottom when an input is incomplete, for example “Based on 93% of product costs”, with a link to finish it.
- Click the card to open the orders or products behind the number, on the same dates and sorted by what drives it.
- … menu to open those orders or products, or add the metric to the Performance trend.
Export
Section titled “Export”Use Export in the dashboard header to download the current view as CSV, Excel or PDF (formats depend on your plan).
Related
Section titled “Related”Still stuck? Email [email protected].